The eCommerce store industry has tremendously grown in the past five years. This is testimony from the fact that the industry registered a sale of $4.28 billion in 2020 against $1.54 billion in 2015.[1] And, despite the world getting badly hit by the coronavirus pandemic in late 2019, the eCommerce industry is the only one showing promising and exponential growth in the coming 10 years as well.
But, the projected growth also means an ever-increasing competition in the eCommerce market. If you’re the owner of an online retail store, you’ll surely agree with us. So, how to ensure that you survive in this ever-growing competitive space, retain your existing customers, attract prospects, and constantly increase your sales? Keep a check on your business’s KPIs.
KPIs or key performance indicators help measure and analyze the performance of your business in the online retail market. They enable you to understand the growth potential of your business, the psychology and behavior of your customers when they’re on your site, and many other essential factors.
Tracking the right eCommerce KPIs can help you to make better-informed decisions regarding your marketing campaigns, conversions and revenue inflow, customer satisfaction level, and business operations.
But, how to choose the right KPIs for your eCommerce business?
Here’s the catch! There are tons of KPIs that you can monitor, but not all of them are pivotal to the success of your business. Hence, focus on:
- Your goals: Choose the performance indicators that pose a direct impact on the revenue of your business.
- Easy-to-measure: There are some KPIs that are easy-to-measure and give away more information than others. These unique insights can further help to map the progress of your online business.
- The growth KPIs: Select KPIs that help measure the growth of your business depending upon your current growth phase.
- Reality-reflecting KPIs: Some qualitative metrics help see the exact position of your business in the market. They help understand what customers think of your products and the overall viability of your business in the online retail market.
At a macro level, there are more than fifty KPIs that you can use to monitor the performance of your eCommerce store. But, they’re not one-size-fits-all here. Every business is different and so are its goals. However, there are some KPIs that are common to almost all businesses. Let’s take a look.
KPIs to monitor the performance of your eCommerce store
- Conversion Rates
This is one of the most common metrics to track the overall performance of your online business. Conversion rate can be defined as the percentage of your total target audience that takes the desired action and converts into paying customers. This could be a signup, inquiry, purchase, account creation, subscription, content downloads, etc.Conversion Rate = Number of people converting into paying customers / Total number of website visitorsIf your conversion rate is steadily increasing, this would mean that your other eCommerce metrics will also show positive growth. Similarly, if you see a dip in your sales and revenue, this means your conversion rate has dipped as well.
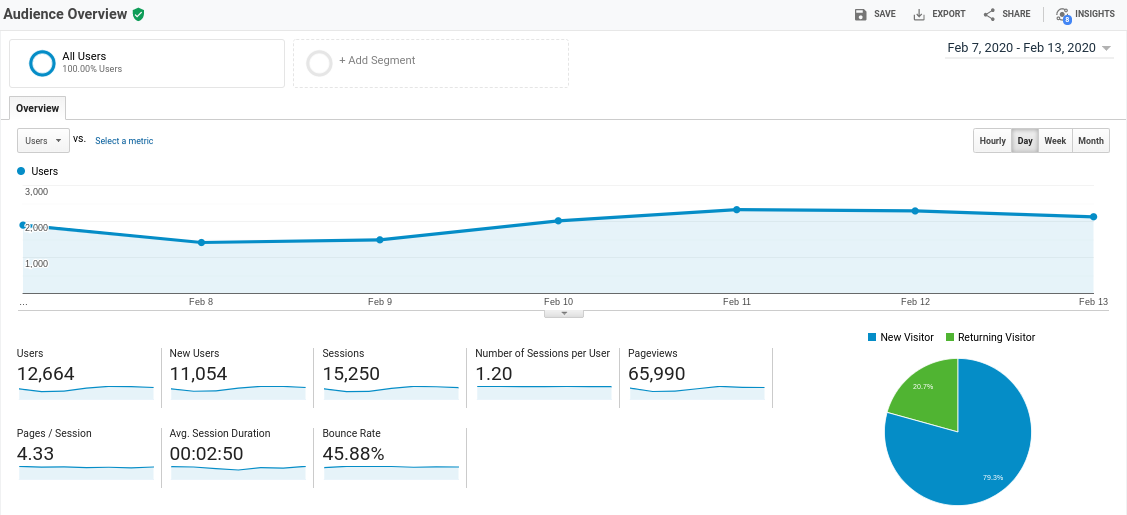
The conversion rate in the case of eCommerce is particularly useful as it helps understand the engagement level of your website. You can use qualitative tools like Google Analytics to see how visitors are moving through your sales funnel, where they’re converting or dropping off, and much more. You can also read our blog on industry-wise conversion rates to learn more about your industry. - Average Order Value (AOV)
Average order value (AOV) or otherwise known as average order size or average market basket gives you an insight into the average amount of money a customer spends on your eCommerce store per transaction.Average Order Value = Total revenue / Total number of ordersFor example, if your eCommerce store earned $2 million in sales through 2,000 orders, then your average order value will be is $1,000.
Measuring average order value helps to accomplish the following goals:
1. Set a baseline for all your average order values
2. Rethink on the lines of your advertising and marketing budgets
3. Develop strategies to increase your average order value
4. Measure the success of your businessThere are many ways to increase your average order value as well. You can use upsell and cross-sell techniques, create product bundles, offer minimum order value discounts, and even provide personalized product recommendations.
- Customer Lifetime Value (CLTV)
This KPI particularly helps to improve your customer retention rate. It’s also useful if your eCommerce store sells high-end products.
Customer lifetime value (CLTV) gives you insights on how much money, on average, a customer is ready to spend on your products during their entire time as a customer. For instance, if a person spends $500 a year over ten years, then their lifetime value as a customer would be is $5000.
eCommerce metrics such as conversion rate, average order value, and customer retention, all are a part of this one KPI. So, mapping customer lifetime value is quite crucial.
The closer the value of your customer lifetime value is to your average order value, the lower shall be your repeat business. In such a case, it’s always advised to optimize the experience of your customers and ensure they come back more often than usual.
Read on ways to increase your CLTV and AOV (Article Link goes here) - Cart Abandon Rate
Cart abandonment is another KPI common to almost all online retail stores. This KPI refers to the percentage of website visitors who add products to their carts or baskets but do not complete the purchase cycle.Unlike bounce rate or conversion rate, cart abandonment rate ideally depends on factors that play a role late in the shopping process. Most often, visitors abandon their carts or baskets for one or more of the following reasons:1. Cost of the product(s)
2. Additional shipping charges
3. Checkout requirements such as signing up to place an order, making paying through specific methods only, etc.
4. Complicated checkout process
5. Error from the user’s end, such as inputting wrong car information, etc.By mapping the cart abandonment rate closely, you can identify and rectify many unknown issues with your checkout process before they do much damage to your business. For instance, if you find that a major chunk of your prospects are abandoning your cart after seeing the lengthy checkout process, it’s time to shorten it. The shorter the checkout process, the lower shall be your abandonment rate.
You are losing more than 10% of your daily revenue and a lot on acquisition costs if you don’t convert the Abandoned Carts (Article link with abandoned cart case study) - Cost per conversion (CPC)
With an increase in ad spend by a majority of eCommerce stores today, this KPI has moved to our common KPIs list. Cost per conversion is the amount you spend on converting a website visitor into a paying customer.
Unlike many similar metrics, it’s quite fair and straight to calculate the cost per conversion value of your business. You can also find the value in your Google Ads reports.
Let’s still give you an example of how the cost per conversion is calculated. Say you have a PPC ad running on Google Ads that pays 10 cents per click, and it received 60 clicks there’s a conversion. This means that your average cost per conversion is $6. As long as purchases made on your website are more than $6 you’re making profits, right?
Not really. Besides the above calculation, you also need to consider the amount of time taken to set up the ad, the cost to ship the product to the customer’s doorstep, the time to develop or prepare the product, and so on.
This may sound like a complicated KPI to calculate, but once you have the right formula to do so, it helps you make really smart decisions for your business. These include the price of your products, minimum or maximum advertising spends, setting marketing campaign budgets, and so on.
Constant and correct mapping of this KPI also ensures you stay profitable and gain a competitive edge in the market.
To conclude, there are tons of KPIs that can help monitor the performance of your eCommerce store. But, knowing which ones will best help identify the true value of your business is critical. If you wish to know more about eCommerce metrics or want to get into the game of conversion rate optimization, give us a call today. We can help take your business to new heights with the least effort involved.


I get pleasure from, result in I discovered
just what I used to be looking for. You have ended my 4 day long hunt!
God Bless you man. Have a nice day. Bye