 ChatGPT
 Perplexity
 Claude

“It is a capital mistake to theorize before one has data.”
This warning by the ever-iconic Sherlock Holmes is a sermon that modern ecommerce platforms need to swear by.
You’ll agree with the use of “need” up there.
Online businesses are trickier than their traditional counterparts for the former’s functional complexity on the table. Ecommerce metrics are the peaks and reality checks to assess the direction your business is sailing in. It can, understandably, be overwhelming to look at them due to their sheer numbers.
Identifying key ecommerce metrics is a requisite for improving decisions on strategy turnarounds or revenue boosts for reliable growth. This piece is to walk you through the fact that all the numbers on your analytics dashboard are not necessarily relevant, at least regularly.
Assess the Key Performance Indicators (KPIs) you need to track for fruitful conversion rates. Instances include:
You are clearly at a disadvantage without such information.
Here are some top ecommerce metrics to list under the KPI bracket for regular and close monitoring.
It’s the number of customers that complete a sale after visiting your site. Conversion rate and overall revenue indicators are intrinsically tied.
Making a sale is not an isolated event; it’s one of the customer stages that comprises:
Discovery >> Consideration >> Conversion >> Retention >> Advocacy
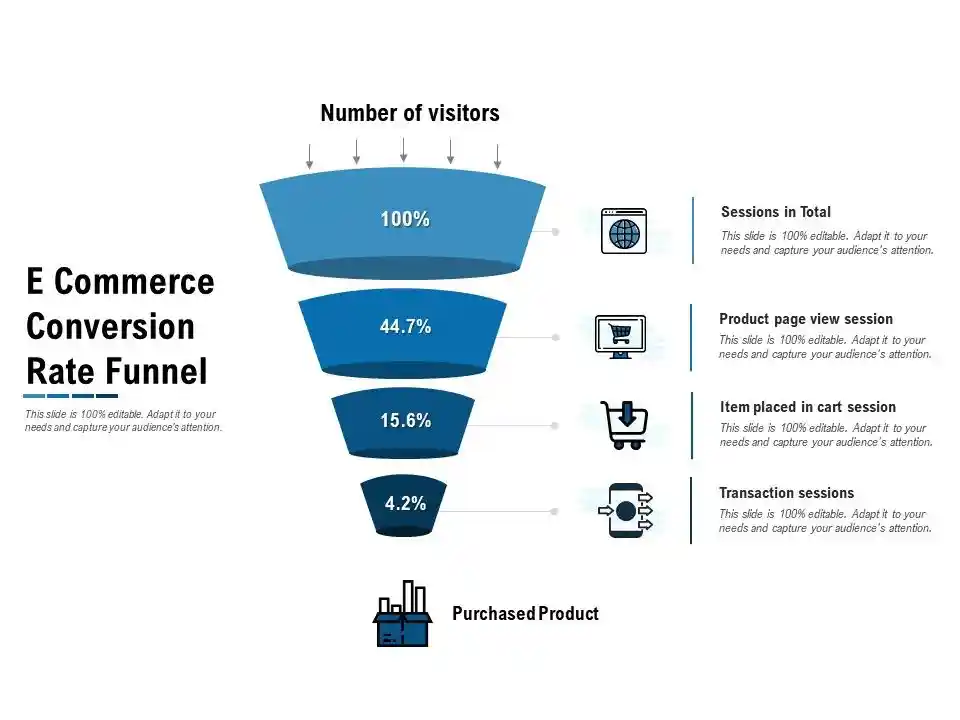
Persuading a customer to purchase a product is one of the essential retail ecommerce metrics. There could be many issues if your conversion is low – website design, less advertising, to name a couple.
Here’s how you work it
CR = (Total number of customers / Total Unique Visitors) * 100
You can improve this rate by using conversion rate optimization (CRO). Analyze your sales funnel and customer behavior on-site to identify shortcomings and turn them around.
2. Customer Acquisition Cost
The cost per acquisition is how much it costs to gain a new customer. The costs could include advertising costs, email campaigns, discounts and loyalties, and more that went into making the sale.
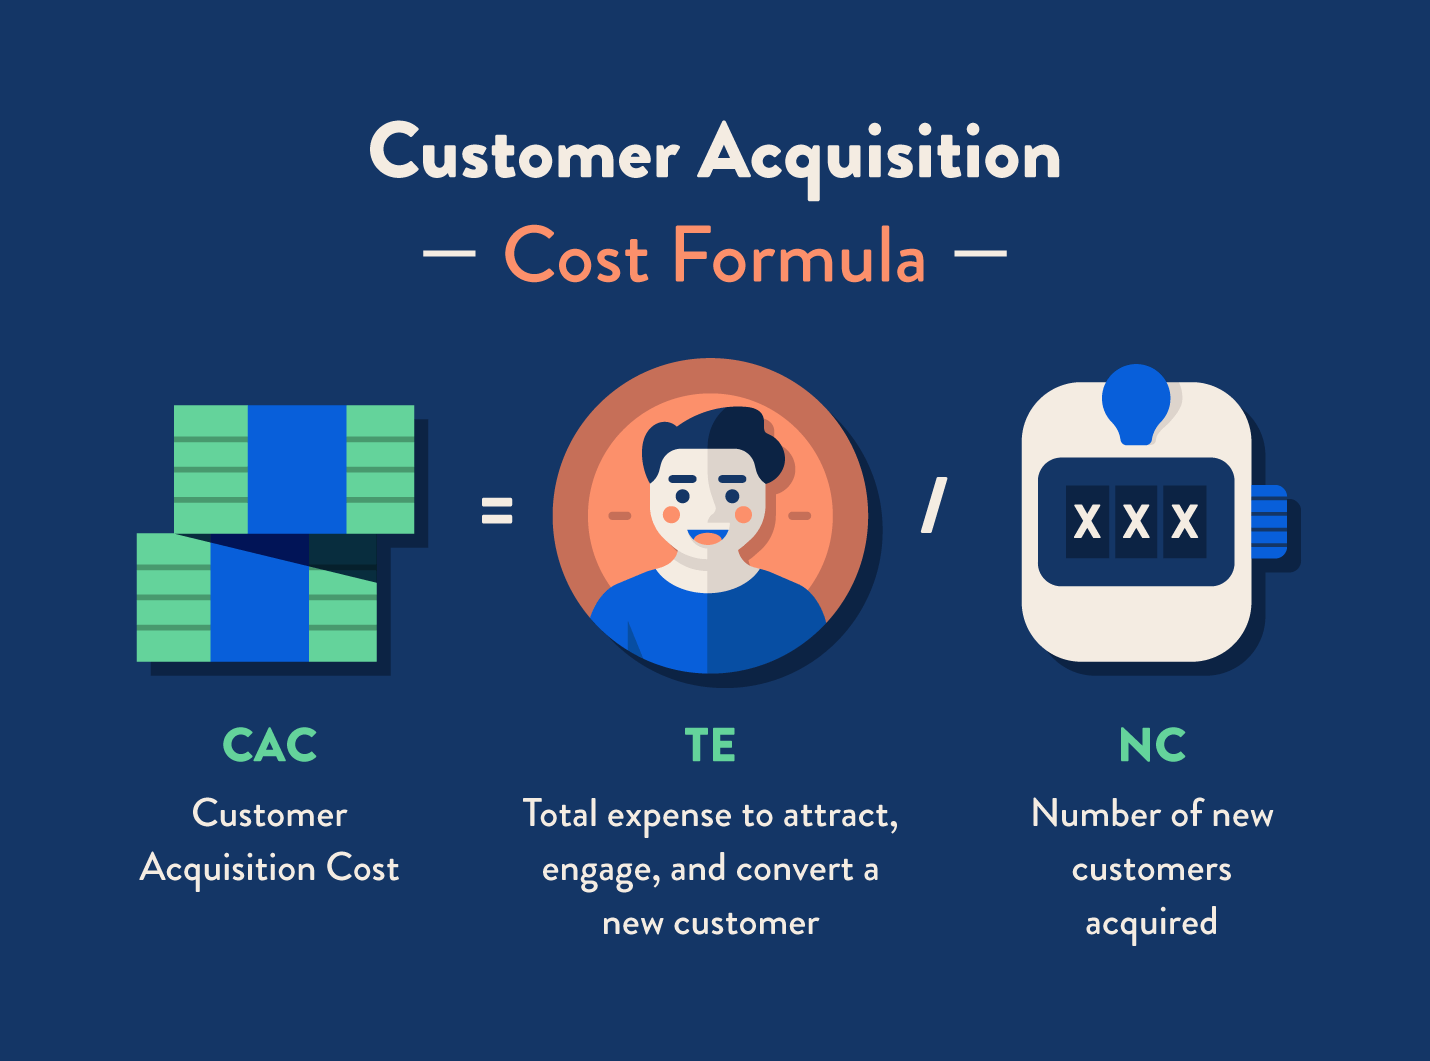
CAC = Total costs associated with acquisition / Total new customers
Start with analyzing all your acquisition channels like social media, ads, review platforms, referrals, et al.
Identify the categories with highest performance so that you can prioritize expenses in that direction. Funnel your ad campaigns to streamline the budget, avoiding excess costs.
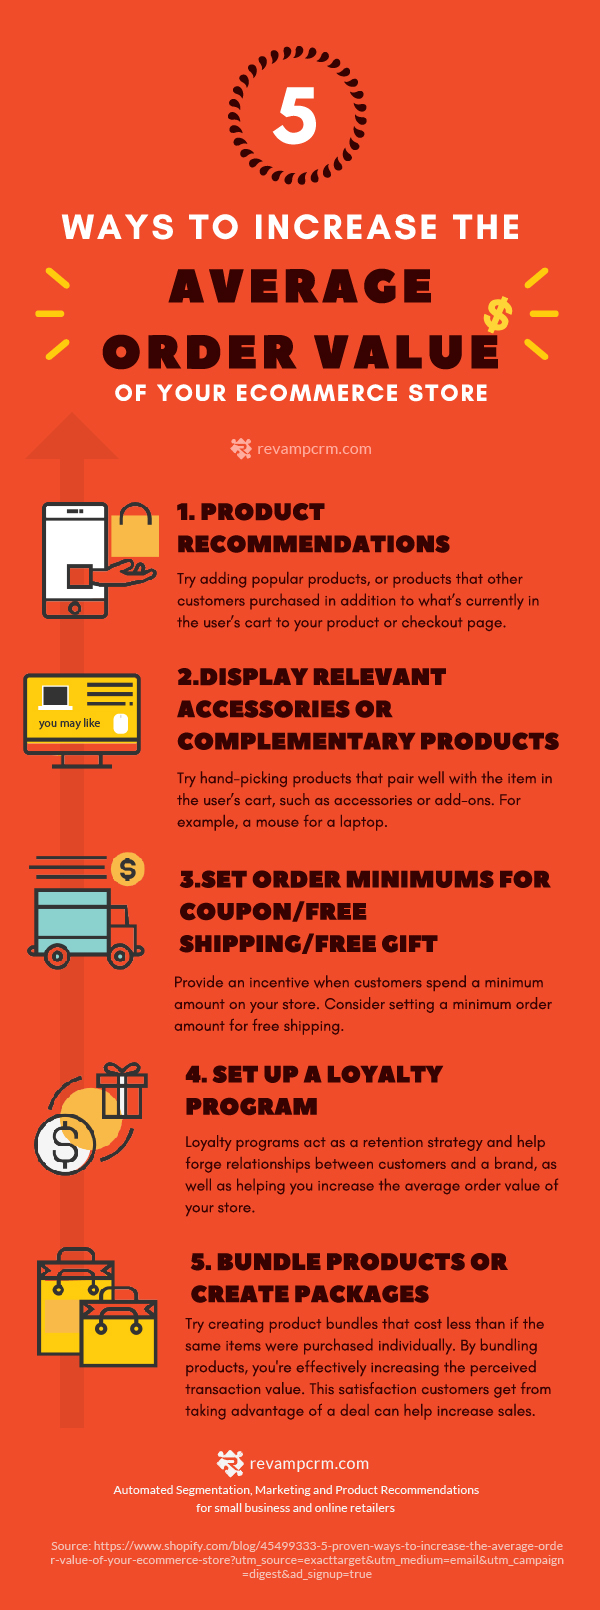
3. Average Order Value
It’s an important indicator as it shows your earning per customer.
Compare the average order value with the cost of acquiring new customers. This helps you determine the customer acquisition budget.
Identifying the sources of your highest AOV customers will help you run more ROI-inclined advertising campaigns. Some ideas to improve this include:
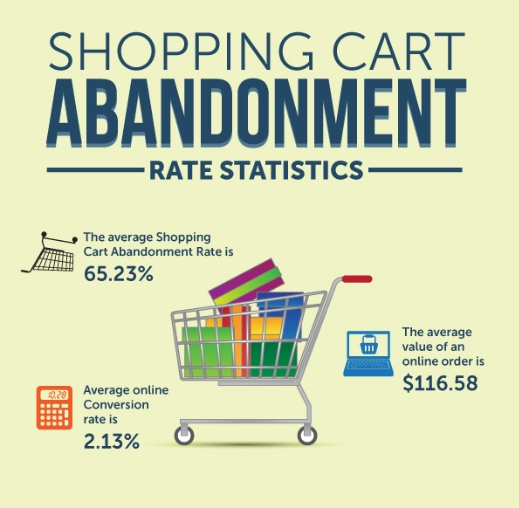
4. Shopping Cart Abandonment Rate
As discouraging as it sounds, your conversion rates dip when potential customers exit without confirming the purchase.
You can arrive at it by dividing the number of purchases by the number of shopping carts created by customers. To get the cart abandonment percentage, subtract this value from one and multiply by 100.
Cart Abandonment Rate = 1 – transactions completed/current shopping carts * 100
It is a crucial ecommerce metric as it underlines how well-designed your checkout process is. You can use this figure to view abandonment as a whole on your storefront. You can accordingly segment the metric by customer device type, location, and others to draw better insights into the behavior of customers using shopping carts.
5. Customer Retention Rate
Customer retention rate (CRR) is the proportion of buyers who come back repeatedly over a while.
CRR = (Number of customers with more than 1 order / Total Customers) * 100
The result is a percentage representing retained customers. Customer retention is one of the vital KPIs for ecommerce.
Acquiring new customers is more expensive than serving existing ones, so maintaining a loyal customer base is in your best interest. Another observation out of low CRR is apparent dissatisfaction with some aspect of your service or products.
This KPI takes time to measure, so you need to focus on building good customer numbers.
A few ways to improve the CRR game include:
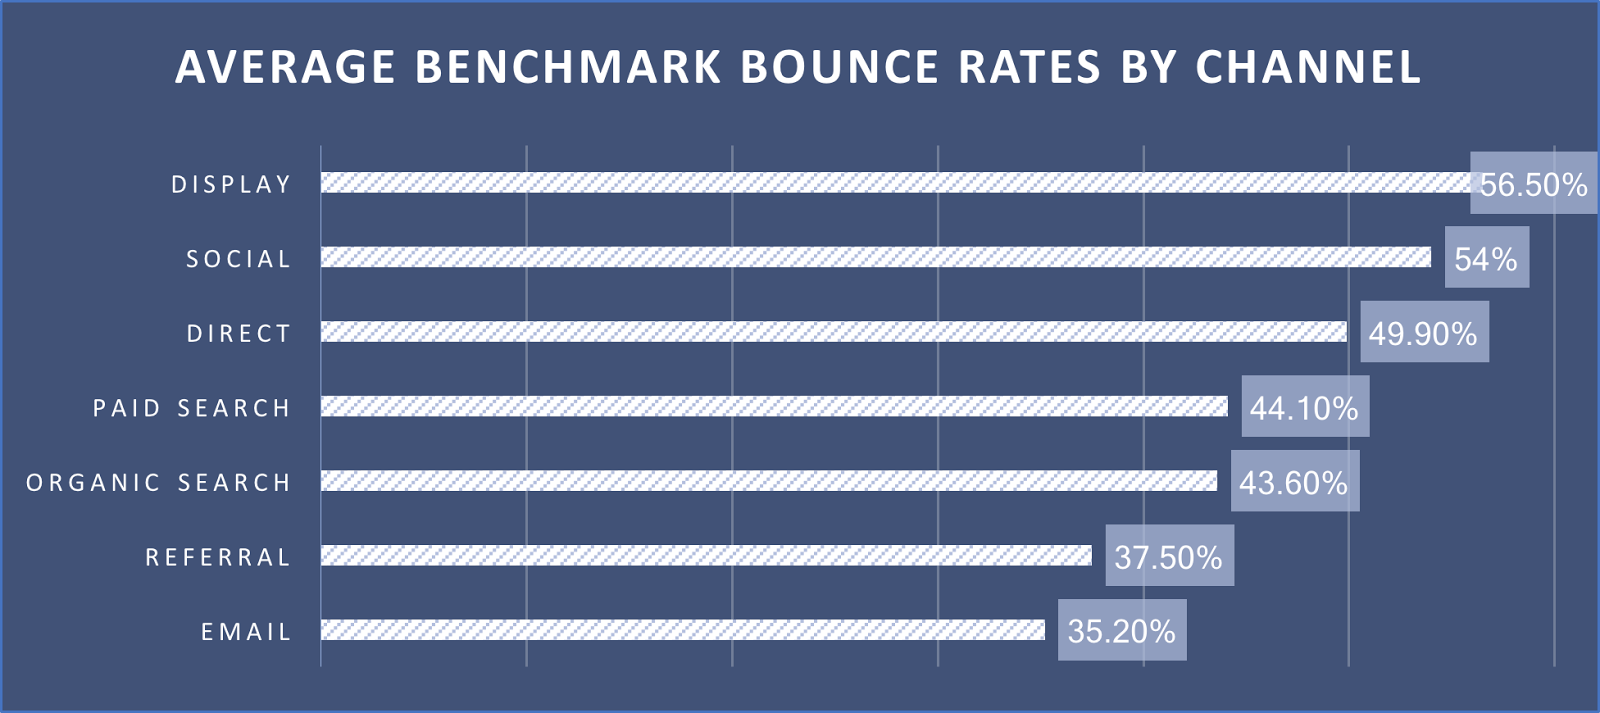
6. Bounce rate
This is the percentage of customers that abruptly leave your website after viewing only one page. It could also mean the number of people who exit without taking any action. It is often touted as a prime in Google Ranking Factor – a crucial set of criteria that Google used to fetch the order of relevant results for a search query by customers. A few others include on-page optimization, external and internal links, and keywords.
Low bounce rates translate to UX issues like load time drag, complex or cluttered navigation, or content design. You could:
Your chosen basket of primary KPIs and their performance standard depends on your line of business and niche, so a cookie-cutter approach won’t deliver. Use internal and external benchmarks to assess your performance compared to your past, and pre-set industry standards.
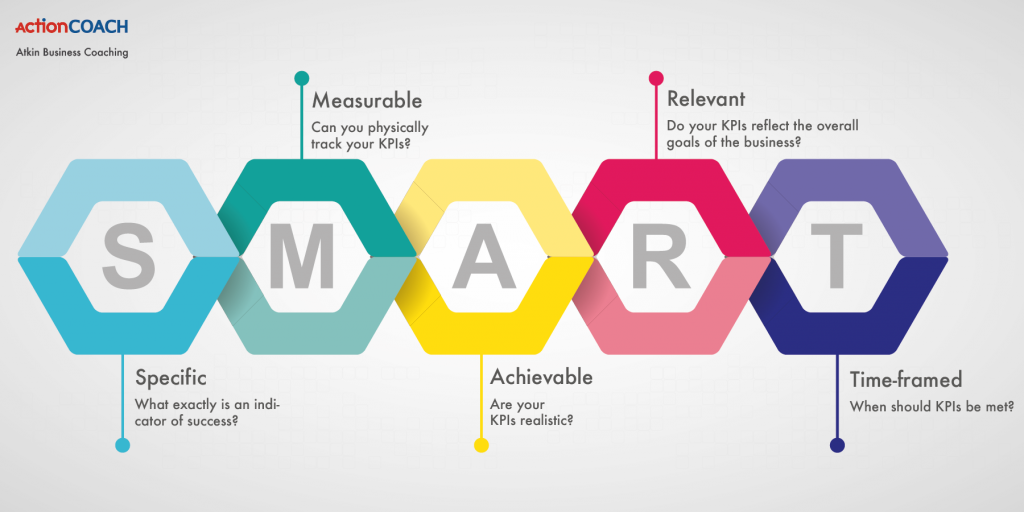
Identifying KPIs that are SMART:
Specific to your industry and requirements
Measurable – collect data and store it securely, and visualize in a structured manner to draw insights
Achievable – select metrics that allow you to maneuver, pivot, and improve your website
Relevant – The metrics resonate with your business objective and overall value system
Timely – Few metrics pay off when you capitalize instantly, but a few can only be measured with longitudinal data.
Ecommerce is dynamic and so are the decisions to progress in the industry. This brief walk-through is sure to clear some smoke on the metrics that need to be marked ‘must-monitor’ to begin with. Metrics are no more than a statistic, unless reevaluated and reset with time. Draw out metrics that are most important to you as KPIs, and refine them gradually using the SMART methodology.
Ask yourself if “the metric is directly affecting one of your SMART targets?” If it’s a yes, you have a solid KPI, and the list can get longer as you grow. So which of the above metrics are you going to analyze in your analytics log today?


Comments are closed