ChatGPT
 Perplexity
 Claude


You don’t have a traffic problem. You have a visibility problem.
Most D2C teams running multiple storefronts, a main site, a quiz funnel, a kids’ line, and an app are flying four planes with four separate cockpits. Nobody sees the whole picture until the numbers are already wrong.
Summarize this post in AI's:
This Week’s Signals
News: The Pant Project raised ₹109 crore Series B. The menswear D2C brand, led by Mirae Asset Venture Investments, is expanding into jeans, athleisure, and casualwear across multiple product lines under one brand.
Signal: Capital is flowing toward brands that can scale category complexity without scaling operational chaos.
Why it matters: Adding product lines without adding a way to see performance across them is how founders end up guessing which category is actually profitable.
News: Chapter Home raised ₹63 crore at a near-₹1,000 crore valuation to expand categories and distribution.
Signal: Multi-category, multi-channel D2C is the funded model right now not single-SKU simplicity.
Why it matters: More channels means more dashboards, unless you build one view that spans all of them.
News: Recur Club launched a ₹500 crore fund for D2C brands ahead of the festive quarter, citing a roughly 35% rise in growth-capital demand during this period.
Signal: Capital is being deployed specifically against inventory and expansion risk during peak demand. Why it matters: If you can’t see per-platform conversion and return rates in real time during this exact window, you’re deploying that capital blind.
News: India’s festive sales hit ₹24,000 crore in the first two days alone, nearly 6x the average daily GMV run rate, per Redseer.
Signal: The margin for error during peak season has never been smaller or the stakes higher.
Why it matters: A founder checking four separate dashboards during a 6x demand spike is already behind.
Case Study: One Toggle, Four Businesses
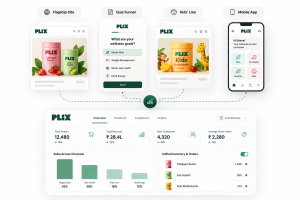
A multi-brand D2C operation was running four distinct storefronts: a flagship site, a quiz-funnel brand, a kids’ line, and a native app each pulling its own traffic, its own customers, its own numbers.
The problem wasn’t a lack of data. It was too much of it, scattered. Conversion rates, ad-source breakdowns, COD versus prepaid splits, repeat-customer percentages, top-selling SKUs, city-level traffic all real, all tracked, none unified. Each platform had an owner. No one had the whole picture.
The fix was structural, not cosmetic: one analytics layer, with a single toggle to switch between brands. Click into the app view and every metric orders, product performance, payment mix, return rate — filters instantly to that business alone. Switch to the kids’ brand and the same lens applies there.
The result wasn’t just cleaner reporting. It surfaced blind spots immediately when one brand’s prepaid share was unusually high, a signal that would have taken weeks to notice buried in a separate spreadsheet. Decisions that used to require four conversations now take one look.
Lesson: Fragmented dashboards don’t just slow you down, they hide the decision that actually matters.
Decode: The Real Cost of a Split View
Founders rarely ask “do we have the data.” They almost always have it. The real question is whether anyone can see across it fast enough to act.
A unified view does three things a scattered one can’t: it makes cross-brand comparison instant instead of manual, it surfaces outliers before they become quarterly surprises, and it puts one person, not four, in a position to make the call.
Practical starting point: if your team can’t answer “which of our channels is underperforming right now” in under 60 seconds, your dashboards are working against you, not for you.
Takeaway
Festive quarter GMV is moving at 6x normal run rate. Capital is flowing toward multi-category, multi-channel D2C brands. Neither trend forgives a fragmented view of your own business.
Build the single pane before you need it under pressure, not during it.
Reach out directly:
Talk to us: https://farziengineer.com/contact-us/?utm_source=newsletter&utm_medium=email&utm_campaign=35
Frequently Asked Questions (FAQs)
1.What is a unified multi-brand analytics dashboard?
A single interface that lets you toggle between multiple storefronts or brands and see the same core metrics orders, conversion, traffic source, payment mix for each one without switching tools.
2. Why do D2C brands running multiple storefronts need this?
Because each platform owner typically only sees their own numbers, making cross-brand comparison slow and blind spots easy to miss.
3. What metrics should a unified dashboard track?
Conversion rate, ad-source performance, city-level traffic, COD versus prepaid split, repeat versus new customer rate, and top-selling products per platform.
4. How does this help during the festive season specifically?
With GMV spiking to roughly 6x normal daily rates during India’s festive sales, slow or fragmented reporting directly costs revenue and inventory decisions.
5. Does this replace Shopify or GA4 analytics?
No, it sits above individual platform analytics, consolidating what’s already being tracked into one comparable view.
6. Is this only for brands with an app and website?
No, it applies to any brand running more than one storefront, sub-brand, or sales channel, including quiz funnels, regional sites, or marketplace stores.
7. How long does it take to build a system like this?
It depends on how many data sources need integration, but the core toggle-based structure can typically be built in a few weeks once source data is clean.
8. What’s the biggest risk of not having this?
Decisions get delayed because no single person can see the full picture, and underperforming channels go unnoticed until the numbers show up in a quarterly review.
9. Can this work for brands without a dedicated data team?
Yes, the goal is to reduce dependency on manual reporting, not add to it.
10. Who should read this newsletter?
D2C founders, CMOs, and operators managing more than one brand, storefront, or sales channel.